HOW IT WORKS
Observability
Splunk® Database Monitoring
Pinpoint and resolve slow queries, correlate application performance issues, and get AI-powered recommendations to accelerate fixes.
Identify performance bottlenecks
ind the slowest and most resource intensive queries to proactively optimize database performance before it impacts your applications and users.
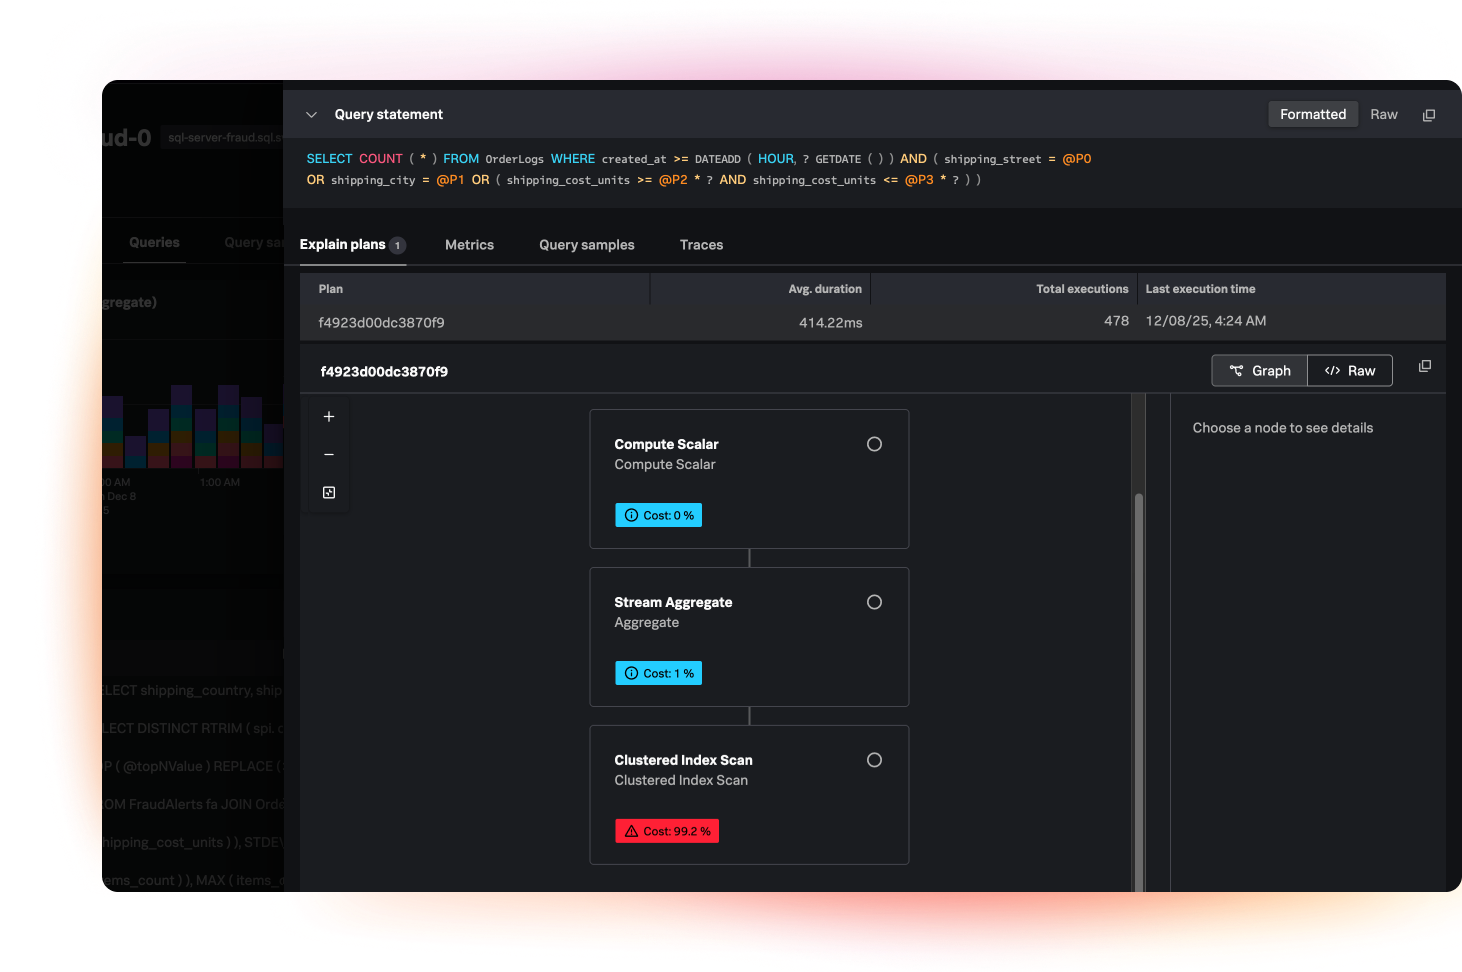
Troubleshoot with execution plans
Analyze execution plans to see how your database engine executes a SQL query to pinpoint the costliest operations and optimize for better performance.
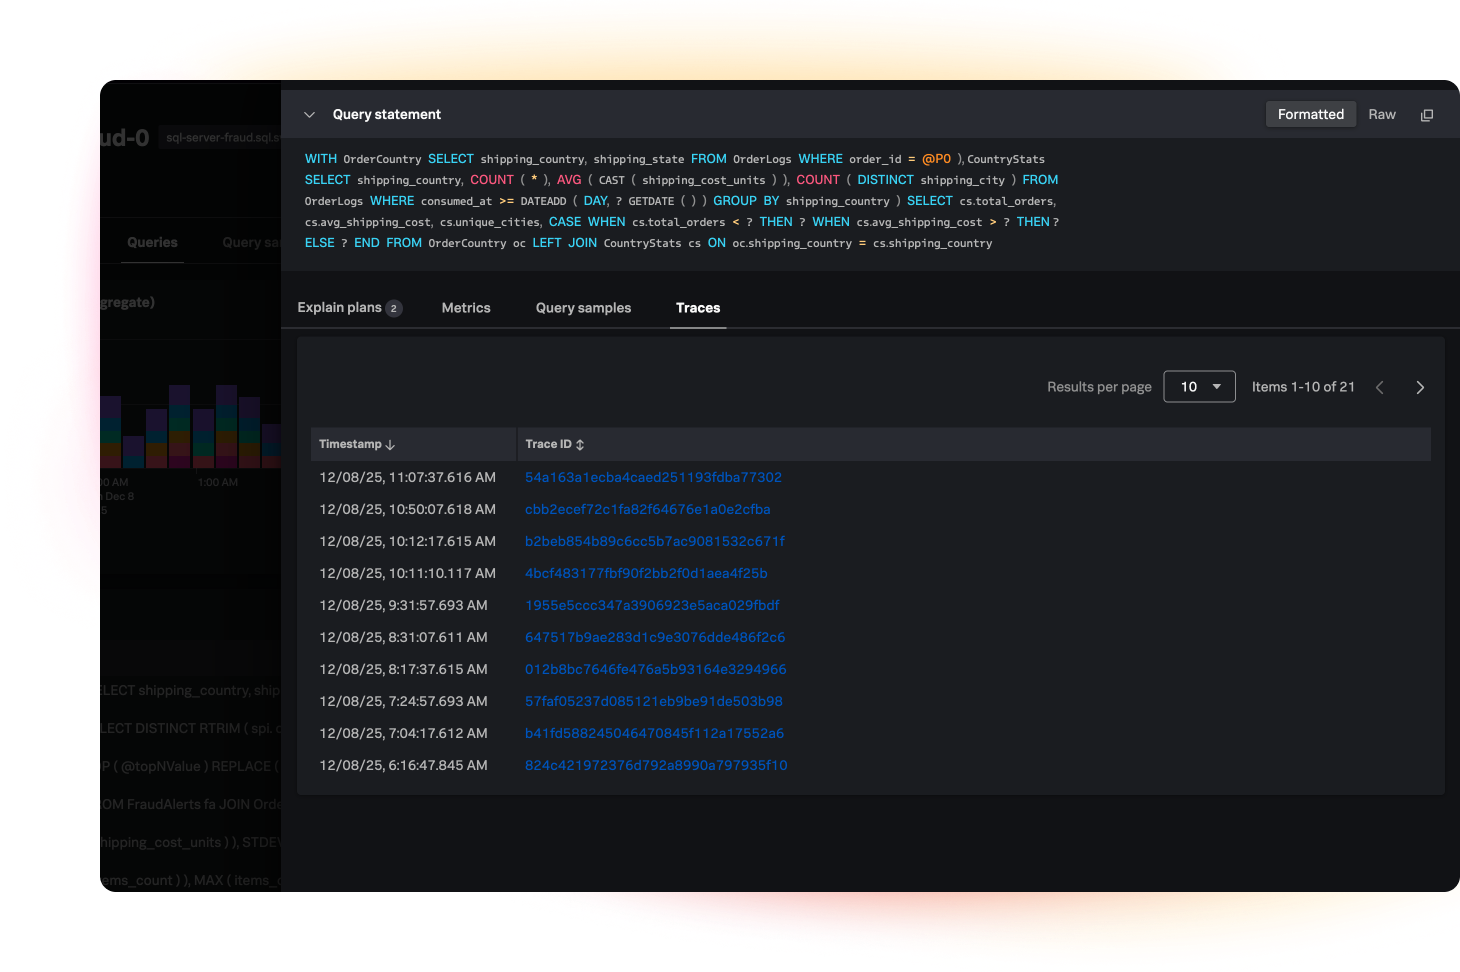
Correlate with application
Correlated database performance metrics with application traces help you see which application services or endpoints execute slow queries. Use infrastructure metrics to understand if the database host is experiencing CPU saturation, memory pressure, or disk I/O bottlenecks.
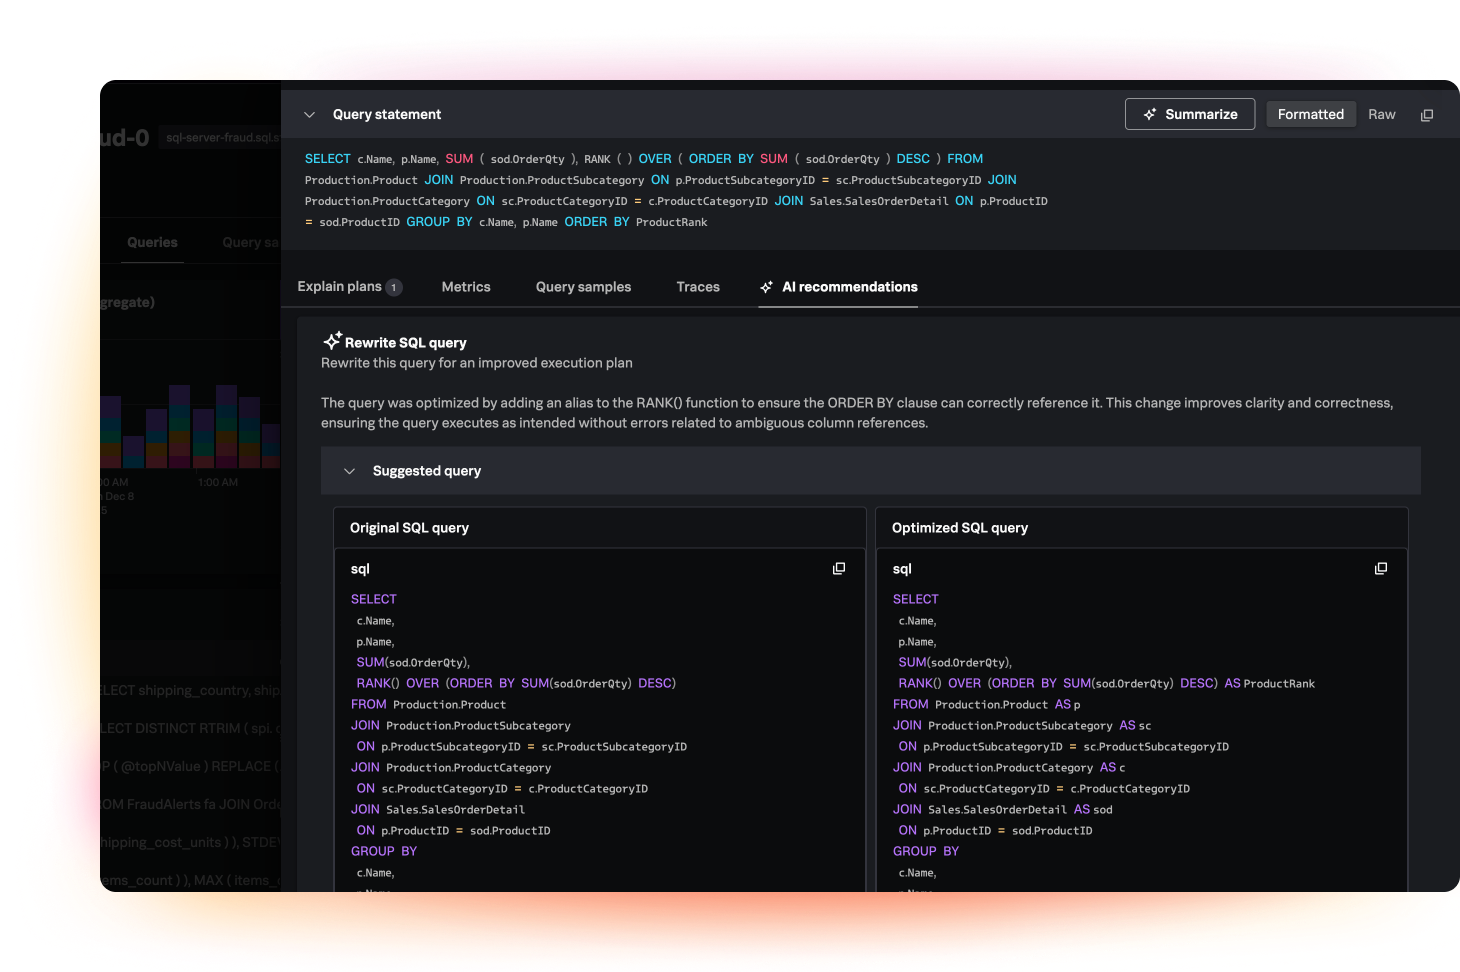
Fixing faster with AI
Use generative AI recommendations to understand and rewrite complex SQL queries for optimal performance and improved recommendation plan.
Features
End-to-end visibility from end user to backend database
Splunk provides the granular insights needed to understand exactly what's happening inside your databases, how it impacts your applications, and how to resolve issues quickly. This means less guesswork, faster resolution, and better service reliability.
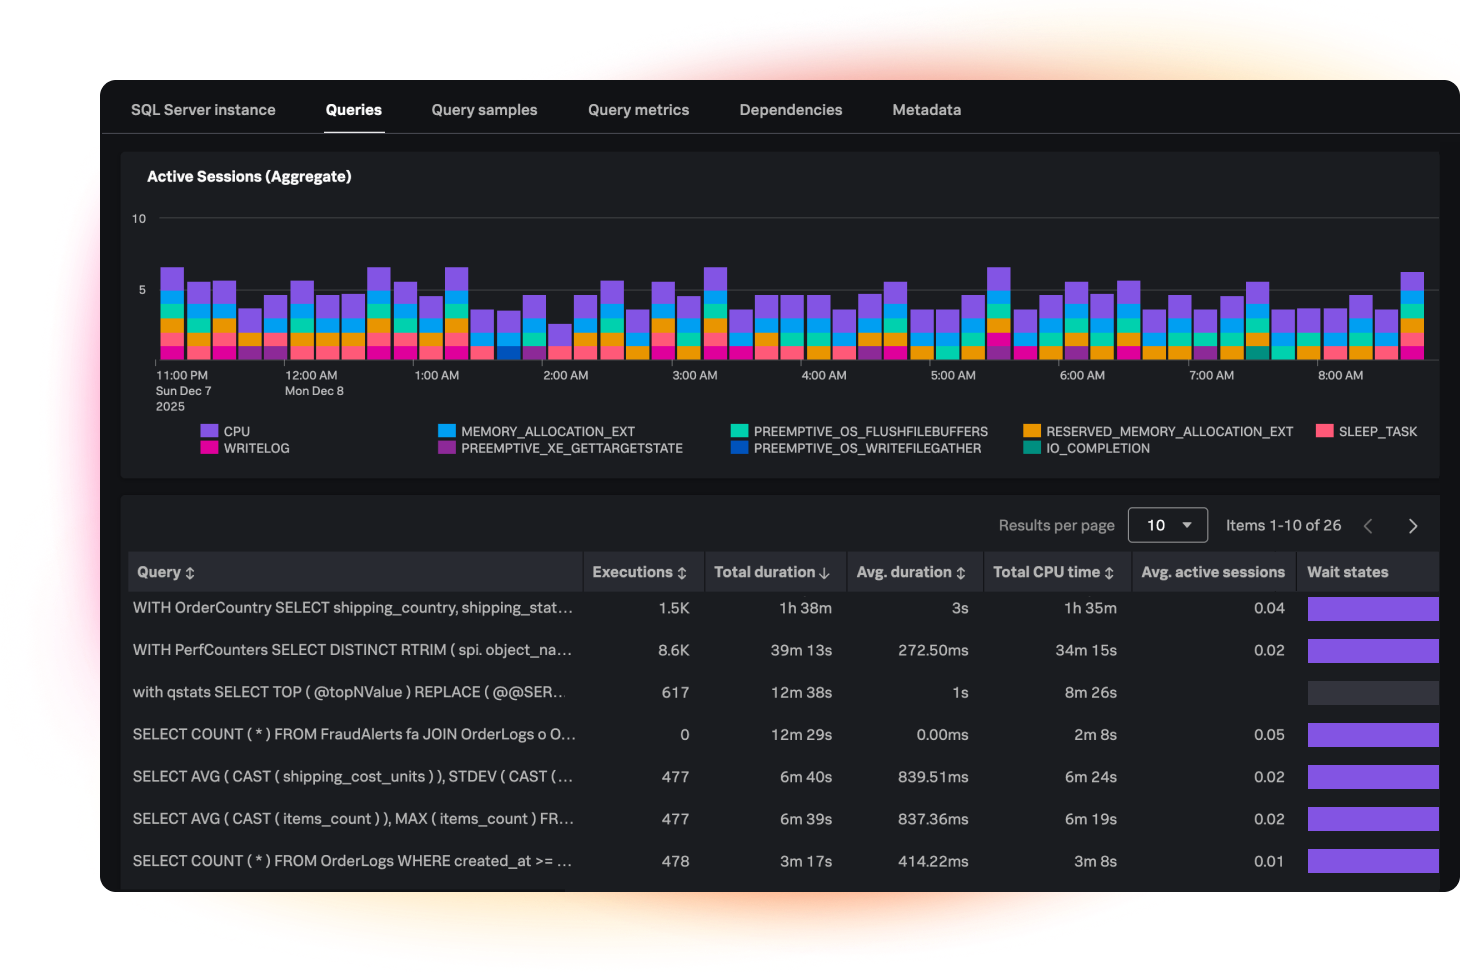
Query Statistics
Observe wait time, CPU time, rows read compared to rows returned, and execution plans.
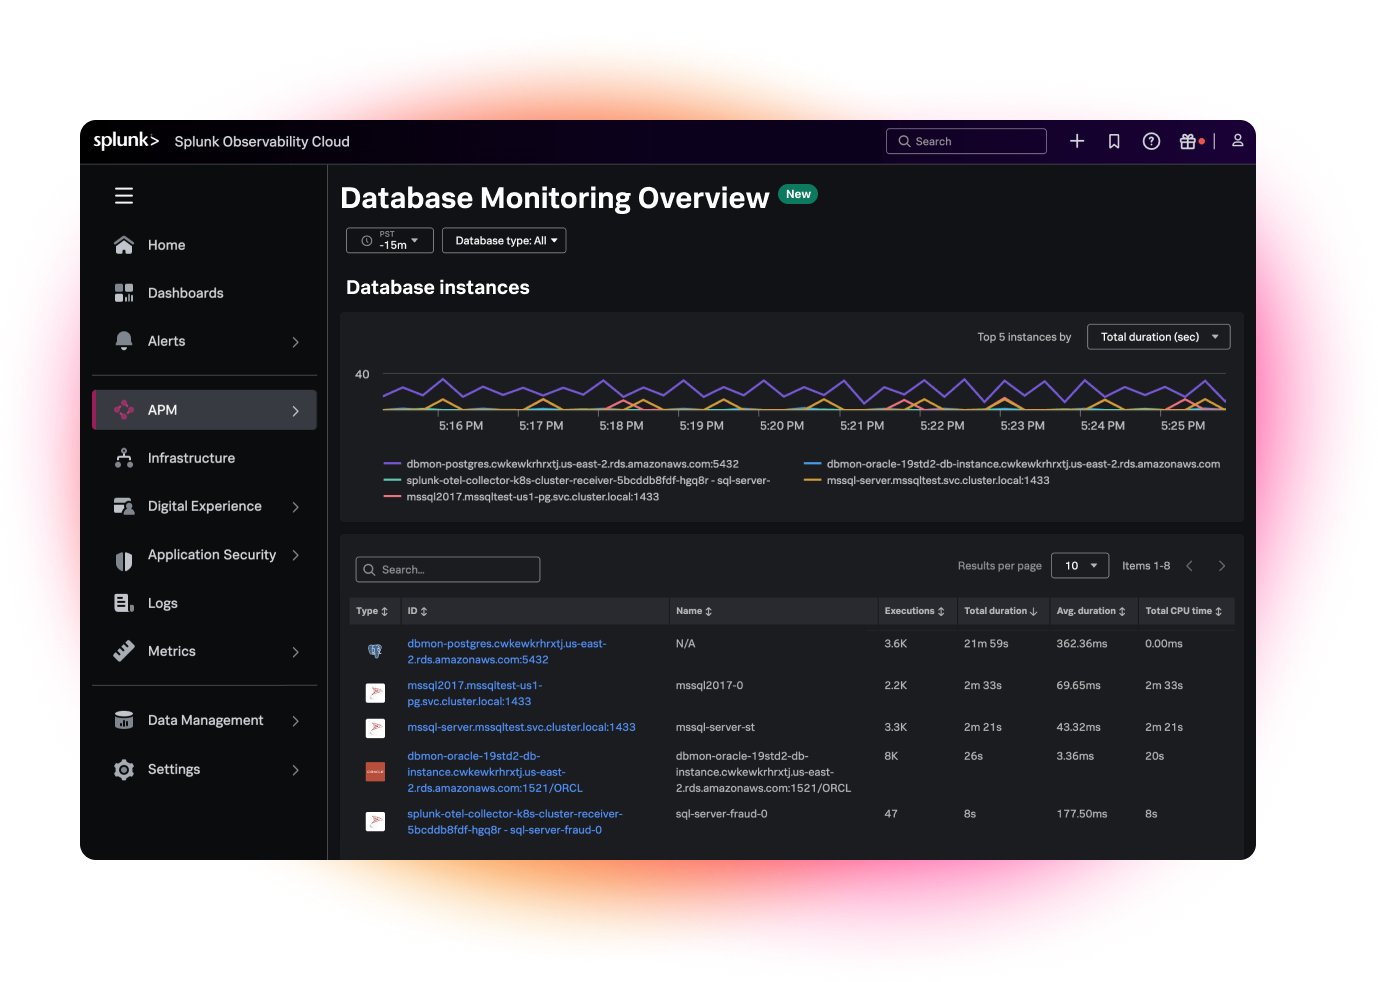
Health and Performance Metrics
Quickly spot and resolve query slowness and inefficiencies across your entire database within a single tool.
Query Analytics
Gain insights into query performance, including wait time, CPU usage, memory consumption, and execution plans.
Application Correlation
Correlate deep query analytics with APM to see how database behavior impacts services and business workflows.
Infrastructure Correlation
Link query analytics with Splunk IM to troubleshoot performance issues caused by resource contention on the database server.
Unified Monitoring Interface
Access a single-pane-of-glass view across database, application, infrastructure platforms with an intuitive interface designed for DevOps, ITOps, and SREs.


Related solutions
Application Performance Monitoring
Solve problems faster in monoliths and microservices by immediately detecting problems from new changes, confidently troubleshooting the source of an issue, and optimizing service performance.
Infrastructure Monitoring
The only real-time, analytics-driven multicloud monitoring solution for all environments.
Logs in Observability
Log analysis across your cloud-native application and cloud environments.
Real User Monitoring
The only full-fidelity, end-to-end visibility solution for end-user experience.
Synthetic Monitoring
Go beyond basic uptime and performance monitoring for better digital experiences.
Gen AI-Powered Experience
Find issues even faster, get expert guidance for troubleshooting, and improve your productivity with AI Assistant.